Skilled labor - many ways to define it
Welcome to the third installment of our new article series, Data for Development.
Today, we’re going to discuss skilled labor: why it matters and to whom, what we mean by it, and how we can measure it.
The availability of skilled labor was the second highest decision factor cited by corporate executives in Area Development’s survey, right behind labor costs. This topic actually had the highest combined score between corporate executives and consultants, highlighting the critical importance of this factor (see ranks in the figure).
- Find the data they need to understand and tell their community’s economic story
- Generate the insights they need to guide economic development decision-making
- Visualize and synthesize these insights so that all stakeholders – economic developers, business executives, site consultants, elected officials, and residents – can work together to support growth

Defining skilled labor
We’ll take a university- and education-focused approach to defining skilled labor in this post. We’ll benchmark communities’ existing workforce and dive into skilled trades specifically in separate posts in the future.
We look at skilled labor in the following three ways:
EDUCATIONAL ATTAINMENT
The share of the population with a bachelor’s degree or above is perhaps the most common, most general, and simplest proxy for skilled labor. We source this data from the Census’s American Community Survey (5 years, 2017-2021).
UNIVERSITY PRESENCE AND PRODUCTION
A common proxy to measure a metro’s skilled labor force is to look at their university presence. For example, Cushman & Wakefield’s Tech Cities report uses the presence of a university(ies) ranking highly in QS World University Rankings as a proxy for computer scientist talent quality. Similarly, CBRE’s Tech Talent reports go a step further comparing regional university production against a talent gain/drain (in addition to a variety of other measures).
In our dashboard, we map the location of every university in the U.S. and their completion figures from the IPEDS database for every major for 2020-2021 (note: we only show bachelor’s-plus degrees but can show more on request).
We also integrate four prominent rankings and allow users to search by top-ranked universities:
- QS World University Rankings, 2023
- U.S. News & World Report Best Engineering Schools, 2023
- U.S. News & World Report Best National Universities, 2023
- U.S. News & World Report Best Global Universities for Computer Science, 2023
GRADUATE RETENTION
We know production is just half of the measure. Communities should also focus on retaining their talented young graduates as well.
To map the location of college graduates by university, we integrate a novel dataset from an academic paper, “Grads on the Go: Measuring College-Specific Labor Markets for Graduatesv,” by Conzelmann, et al (2022). This fascinating paper analyzes LinkedIn data on alumni who attended more than 2,600+ institutions. The LinkedIn data covers 80%+ of all U.S. alumni who were in attendance between 2010 through 2015.
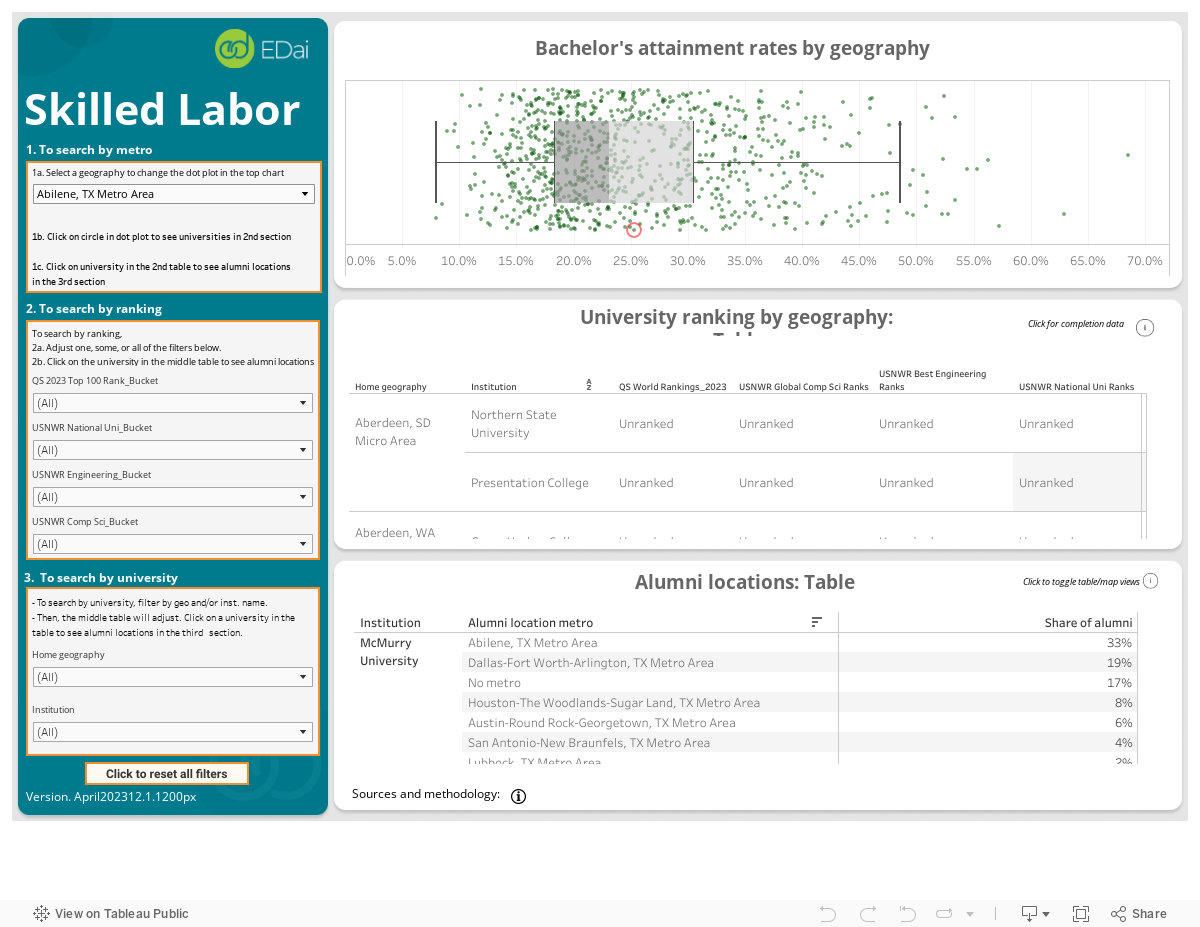
Visualizing skilled labor
In the Tableau
visualization below, we compare 384 metros against each other along educational
attainment levels. We also visualize physical location, completion, and alumni
location data by higher education institution.
** Our dashboard visualizations run best on a desktop and have been disabled for mobile. **
About EDai and Located by EDai
EDai helps business leaders and economic developers make better, faster location decisions using advanced analytics. We add value through our self-serve analytics portal, Located by EDai, and tech-enabled consulting.


