Quality of life: a top factor (depending on who you ask)
Welcome to the second installment of our new article series, Data for Development.
Today, we’re going to discuss quality-of-life: what it entails, how we can measure it, and how each community stacks up.
The general category of “quality of life” was ranked as the second most important location decision factor by corporate executives in Area Development’s 37th Annual Corporate Survey and 19th Annual Consultant Survey (see image for rankings). However, consultants ranked this category 25th out of 31 categories. This ranking difference of 23 spots represents the widest gap in the survey.
Our series tackles the top location factors as identified by corporate executives and insiders. We compile and visualize the data that can be used to benchmark communities (primarily at the metro level) against each other.
This series is designed to equip economic developers with the awareness, knowledge, and skills to accomplish three things:
- Find the data they need to understand and tell their community’s economic story
- Generate the insights they need to guide economic development decision-making
- Visualize and synthesize these insights so that all stakeholders – economic developers, business executives, site consultants, elected officials, and residents – can work together to support growth
To accomplish these objectives, we’ll use Area Development’s 37th Annual Corporate Survey and 19th Annual Consultant Survey, which ranks 31 location decision factors by importance to corporate executives and site consultants, as our roadmap for this series.

Defining quality of life
Let’s state the obvious: there is no one definition of quality of life. Generally, the phrase tries to capture all of the things – measurable and non-measurable – that make a community a desirable place to live. But, to create a ranking, one must use measures. And, every publication has their own approach.
The table below highlights the range of variables included a very small sample of “best places to live” rankings, an academic study, and even more specific “quality of life” categories.
- Job market index: unemployment rate, average salary
- Value index: blended median annual household income, blended annual housing cost
- Quality of life index: crime rates, quality and affordability of healthcare, quality of education, well-being (from Sharecare Community Well-being Index), commuter index, air quality index
- Desirability index: proprietary desirability survey ranking metros
- Net migration
- Affordability: housing affordability, median annual property taxes, cost of living, median annual household income, homeownership rate
- Economy: unemployment rate, underemployment rate, economic security score (from Sharecare Community Well-being Index), share of population, median debt per median earnings, population growth, income growth, building-permit growth, wealth gap, general tax-friendliness, entrepreneurial activity, job opportunities, foreclosure rate, bankruptcy rate, food insecurity
- Education and health: quality of public school, high school graduation rate, share of population aged 25+ with a high school diploma or higher, share of insured population, quality of public hospital system, premature-death rate, poor or fair health, life expectancy, share of live births with low birthweight, share of obese adults, share of physically inactive adults, percentage of residents 12+ who are fully vaccinated
- Quality of life: average hours worked per week, average commute time (in minutes), miles of trails for bicycling and walking per total state land area, bicycle friendly state ranking, access to public transportation, quality of roads, traffic congestion, restaurants per capita, bars per capita, museums per capita, performing arts centers per capita, movie theaters per capita, fitness centers per capita, accessibility of beaches, weather, air quality
- Safety: violent-crime rate, property-crime rate, traffic-related fatalities per capita, total law-enforcement employees per capita
- Transportation characteristics: transit quality, quality of roads, low congestion, traffic safety, bikeability, affordable transportation options
- Social livability dimension: sense of community
- Physical/climate livability dimension: parks and recreation facilities, clean environment, walkability, weather
- Functional livability dimension: available jobs, quality healthcare, quality public schools, cultural institutions, affordable housing, cost of living, shopping and entertainment options
- Safety livability dimension: low crime
- Physical: Having good health and enough energy to get things done daily
- Financial: Managing your economic life to increase financial security and reduce stress
- Social: Having supportive relationships and love in your life
- Community: Liking where you live and having pride in your community
- Purpose: Liking what you do each day and being motivated to achieve your goals
- Healthcare access: How easily community members can find healthcare facilities or resources
- Food access: The proximity of healthy food retailers and grocery stores to community members’ homes
- Resource access: The proximity of key community resources such as libraries, churches, senior employment, and more
- Housing and transportation: What home values are, how community members use public transportation, and more
- Economic security: Whether community members are employed, insured, and more
- Housing: Housing is measured by metrics and policies that promote affordability, availability, and accessibility.
- Neighborhood: Neighborhood is measured by metrics and policies focused on proximity to key destinations, safety, and supporting mixed-use development.
- Transportation: Transportation is measured by metrics and policies related to convenience, safety, and options.
- Environment: Environment is measured by metrics and policies related to air and water quality, as well as energy efficiency, and hazard mitigation plans.
- Health: Health is measured by metrics and policies that promote healthy behaviors including smoking cessation, and exercise opportunities.
- Engagement: Engagement is measured by metrics and policies that include voting rights, human rights, and cultural engagement.
- Opportunity: Opportunity is measured by metrics and policies that capture job availability, government creditworthiness, and graduation rates.
- Life expectancy
- Uninsured share of population
- Unemployment rate
- Air pollution (particulate matter)
- Share of population facing severe housing problems
- Share of population driving alone in a long commute
- Homicides
Benchmarking quality of life
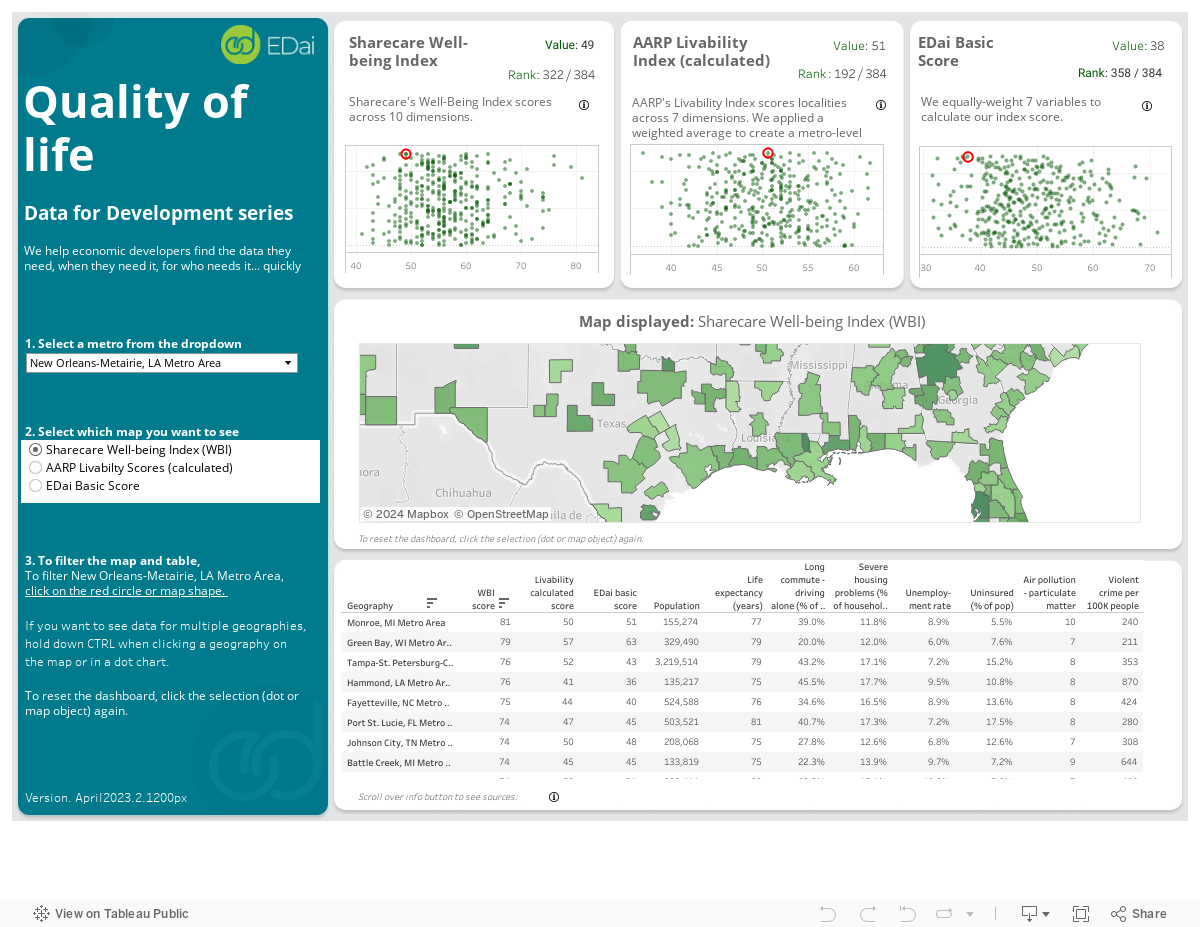
For our benchmarking, we compiled data from Sharecare Community Well-being Index, AARP Livability Index, and a basic collection of variables for our EDai scoring. All of these are indices based on a basket of variables with differences in both the variables and the scoring.
With our our EDai basic scoring, we first scored communities against each other within each variable. We then equally-weighted each community’s variable score to calculate our index score. We’ve used this approach for clients to score communities using 100+ variables alongside an input form that lets them dynamically adjust the weights according to their needs.
In the absence of agreed-upon definitions, we believe it’s better to let the user decide which factors are most important and how important they are in their decision-making.
** Our dashboard visualizations run best on a desktop and have been disabled for mobile. **
About EDai and Located by EDai
EDai helps business leaders and economic developers make better, faster location decisions using advanced analytics. We add value through our self-serve analytics portal, Located by EDai, and tech-enabled consulting.


