The top location decision factor: labor costs
Welcome to our first topic in our new article series, Data for Development.
Today, we’re diving into labor costs: how we can measure them and how each community stacks up.
The general category of “labor costs” was ranked as the top location decision factor by corporate executives and 3rd by corporate consultants in Area Development’s 37th Annual Corporate Survey and 19th Annual Consultant Survey (see image for rankings).
Our series tackles the top location factors as identified by corporate executives and insiders. We compile and visualize the data that can be used to benchmark communities (primarily at the metro level) against each other.
This series is designed to equip economic developers with the awareness, knowledge, and skills to accomplish three things:
- Find the data they need to understand and tell their community’s economic story
- Generate the insights they need to guide economic development decision-making
- Visualize and synthesize these insights so that all stakeholders – economic developers, business executives, site consultants, elected officials, and residents – can work together to support growth
To accomplish these objectives, we’ll use Area Development’s 37th Annual Corporate Survey and 19th Annual Consultant Survey, which ranks 31 location decision factors by importance to corporate executives and site consultants, as our roadmap for this series.

Defining labor costs
Let’s look at three ways to define labor costs, with varying levels of complexity.
| Variable | Source | Details |
|---|---|---|
|
Average earnings |
Bureau of Economic Analysis, 2021
|
We focus on just wages and salaries. This is perhaps the most straightforward and most used metric. |
|
Cost-adjusted earnings |
Bureau of Economic Analysis, 2021
|
We know a dollar in one community does not buy the same amount of goods and services in every community. We adjust each community’s average earnings by their price parity index |
|
Productivity of wages |
Bureau of Economic Analysis, 2021 |
This measure calculates how much output is produced for each dollar in wages paid in a community. It is important to note that this approach masks the differences in industry mix across communities. |
Benchmarking labor costs
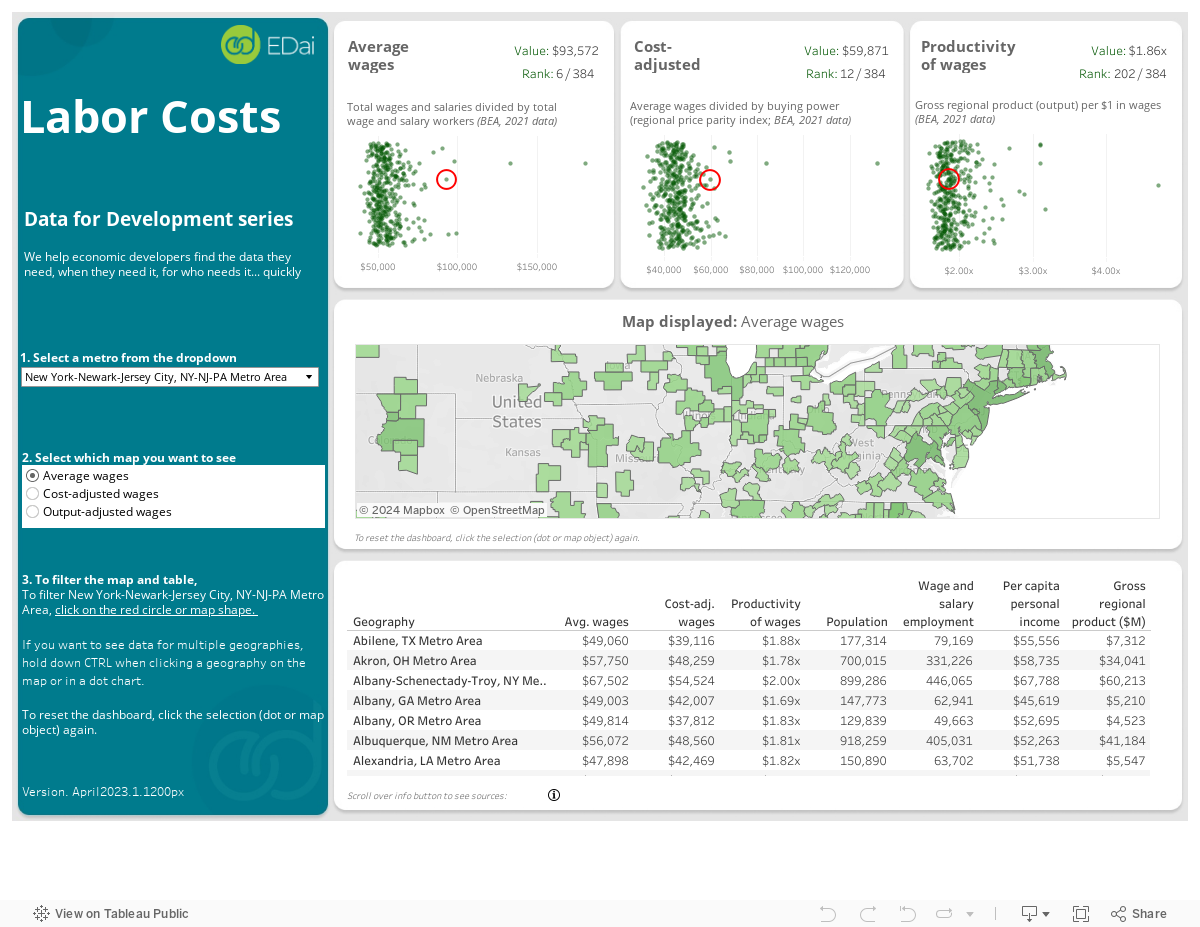
Our Tableau dashboard below visualizes the results by metro area and each of the three definitions. We use averages across all industries though we recognize that industry-specific cuts could yield very different outcomes.
Outliers for average wages and cost-adjusted wages — San Jose and San Francisco — stand out clearly and probably come as no surprise. With wage productivity, places like Midland, TX with capital-intensive industries like oil production stand out.
** Our dashboard visualizations run best on a desktop and have been disabled for mobile. **
About EDai and Located by EDai
EDai helps business leaders and economic developers make better, faster location decisions using advanced analytics. We add value through our self-serve analytics portal, Located by EDai, and tech-enabled consulting.


