Energy availability and cost ranked third among corporate executives in Area Development's annual survey — and for energy-intensive industries like primary metals, semiconductors, and data centers, it frequently rises to the top. The importance varies considerably by industry: a highly energy-intensive manufacturer and a professional services firm face completely different energy profiles, but neither can operate without reliable, affordable power.
Yet reliable, comparable benchmarking data across utilities and geographies has historically been hard to find. Rates are scattered across state regulatory filings. Renewable mix data requires plant-level analysis. Reliability statistics are buried in EIA reports few people read cover to cover.
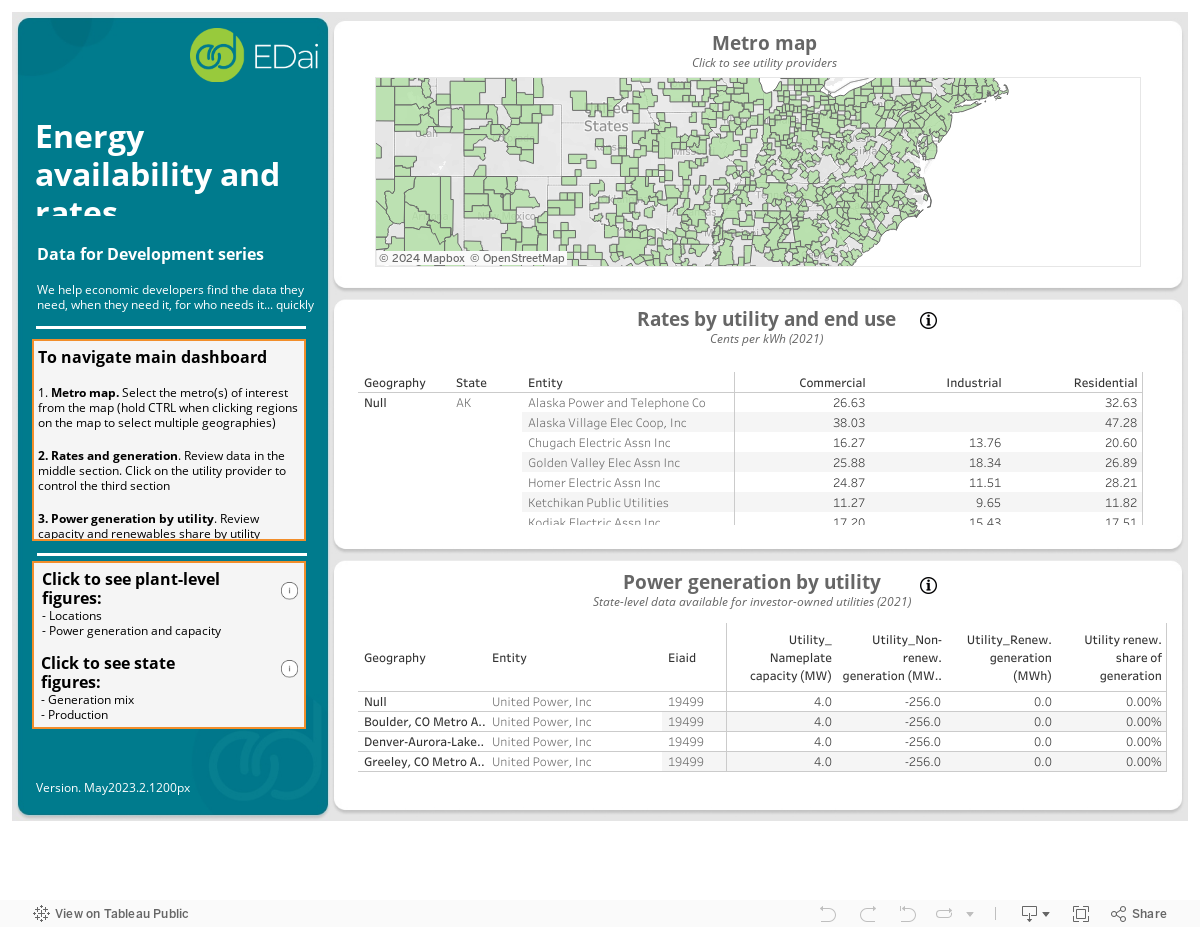
This dashboard pulls it all into one place. Utility-level rates by end use, renewable share of generation by provider and plant, state-level power mix, energy production by source, and three grid reliability metrics — giving site selectors and economic developers a complete picture of any market's energy profile.
The question this dashboard answers
"What will energy actually cost my operation here — and how reliable is the grid?"
Utility Rates by End Use
EIA average electricity rates by utility provider covering industrial, commercial, and residential end uses. Mapped to metro areas for geographic comparison.
Renewable Energy Mix
Renewable share of power generation estimated at both the utility and plant level. State-level power generation mix from EPA Power Profiler and EIA production data by source.
Grid Reliability
Three EIA reliability metrics: SAIFI (outage frequency), SAIDI (outage duration), and CAIDI (restoration time). How often the power goes out — and how long it stays out.
About the data
Utility rates
U.S. Energy Information Administration (EIA), 2021. Average electricity rates by utility for residential, commercial, and industrial end uses.
Power generation mix
EPA Power Profiler, 2021 (state-level generation mix). EIA power plant data (plant-level nameplate capacity and energy source). Renewables share estimated by aggregating plant sources by utility provider.
Energy production
EIA, 2020. State-level energy production across 11 inputs in trillion Btus.
Grid reliability
EIA, 2021. SAIFI (interruptions per customer per year), SAIDI (minutes of interruption per customer per year), and CAIDI (average restoration time in minutes). Non-momentary outages of 5 minutes or more.